TM 10-4320-317-13
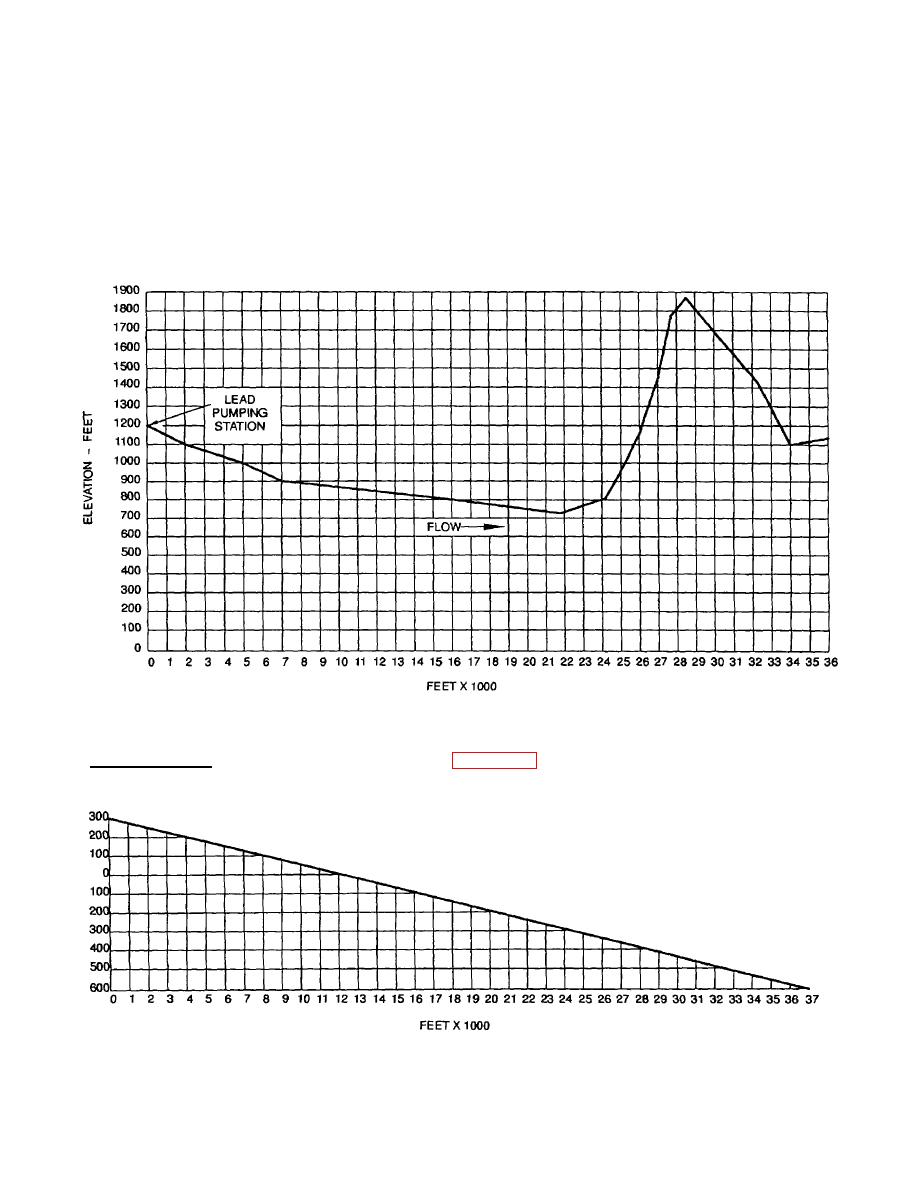
(2) Divide the vertical, left-hand edge of the graph into spaces that represent uniform changes in elevation, such
as 100 ft (30.5 m) intervals. Again, any suitable scale can be used. However, the scale must include at least
the highest and lowest elevations along the hoseline route.
(3) At the left-hand edge of the graph, mark a point that represents the elevation of the lead pumping station.
(4) Continuing across the graph, mark points where significant changes in elevation occur along the hoseline
route.
(5) To complete the ground profile, join the points marked on the graph with a straight line.
Figure 2-2. Ground Profile Graph
h.
Spacing Triangle. To construct a spacing triangle (Figure 2-3), obtain a piece of paper, transparent sheet, or
cardboard thick enough to be used as a straightedge. Then proceed as follows:
Figure 2-3. Spacing Triangle
2-22


